In This Article
Follow BestForAndroid
🔰 TL;DR: General-purpose CDNs handle static objects well. They struggle with petabyte-scale video because video isn’t a file-retrieval problem; it’s a sustained-throughput problem. The architectural gaps show up in four places:
→ cache eviction logic built for objects, not sequential segments,
→ manifest handling that can’t respond dynamically to congestion,
→ backbone behavior that causes invisible degradation beyond the edge, and
→ per-request pricing models that don’t match video’s continuous delivery economics.
The architectural alternatives include multi-CDN orchestration layers, peer-assisted mesh delivery, and compute-at-edge transcoding.
CDNs have handled web traffic reliably for over two decades. They reduced latency for static assets, cached content closer to users, and did so without requiring teams to think much about the delivery layer. For websites, APIs, and image delivery, that model still works.
But once video traffic crosses into 100 TB, 500 TB, or 1 PB per month, something fundamental changes. Video at the petabyte scale operates by different rules.
The problem isn’t that traditional CDNs are slow; it’s that they were designed for a different problem shape. Understanding where the mismatch occurs and why it becomes critical past specific throughput thresholds is the starting point for making better architectural decisions.
Where Traditional CDNs Break at Scale
| Failure Point | Standard CDN Assumption | What Actually Breaks |
|---|---|---|
| 💾 Cache eviction logic | Built for small objects with bursty access | Unstable under sequential HLS/DASH segment streaming; increased disk I/O as segment churn accelerates |
| 📜 Manifest handling | Static playlist served from edge cache | Can’t dynamically steer traffic or respond to regional congestion at scale |
| 🌐 Backbone behavior | PoP counts as the primary performance metric | Transit saturation, peering imbalances, and jitter degrade video more severely than edge distance |
| 💸 Pricing model | Per-request or per-compute-invocation billing | A 2-hour stream generates thousands of segment requests, costs scale non-linearly with video volume |
| ⚡ Concurrency cliffs | Gradual scaling assumptions | Live events create sudden concurrency spikes that expose capacity limits without warning |
Video Is a Flow Problem, Not a File Problem
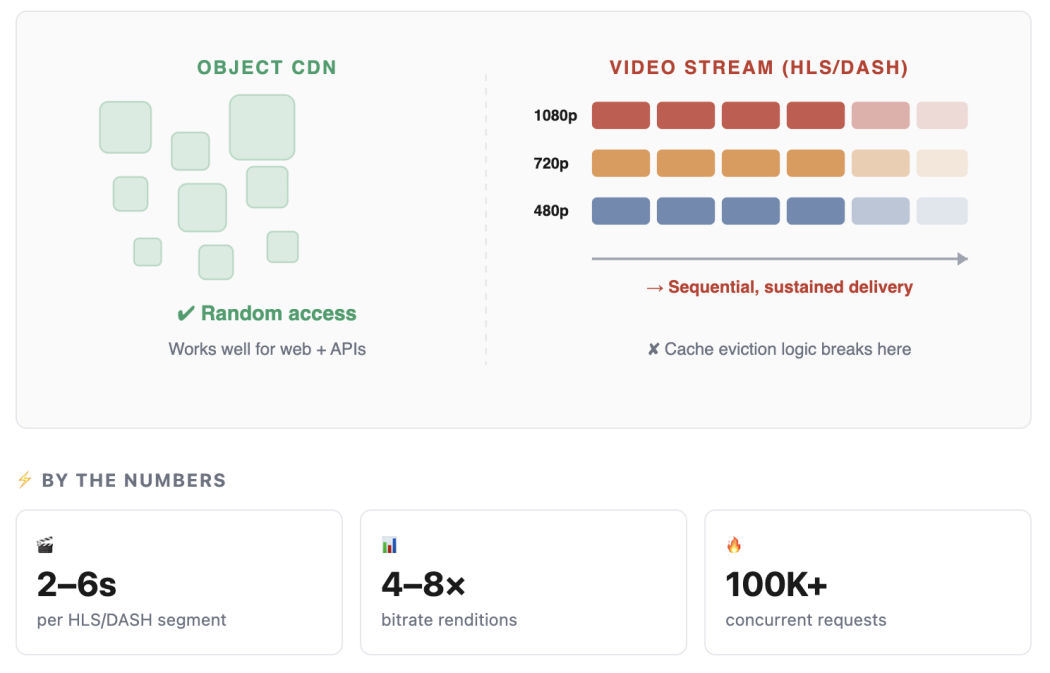
Standard CDN architecture is optimized for objects like small, independently cacheable units accessed in bursty patterns. That model maps well to HTML, images, and API responses. HLS and DASH, the two dominant adaptive streaming protocols, work differently.
Both divide video into short sequential segments (typically 2–6 seconds each) and maintain multiple parallel bitrate renditions. Players constantly request the next segment in sequence, adapting quality based on network conditions.
Under modest traffic, a file-oriented CDN handles this acceptably. At sustained high concurrency, the inefficiencies stack. Cache eviction policies tuned for random-access objects start competing with sequential segment access patterns. Disk I/O rises as segment churn accelerates. Memory allocation strategies built for small objects introduce latency variability exactly where consistency matters most.
The result shows up as bitrate drops and rebuffering rather than outright failures, which makes root cause analysis harder.
- HLS/DASH segments: 2–6 seconds each, served sequentially across the entire session duration
- Multiple bitrate renditions: a single stream may maintain 4–8 parallel quality variants at any given moment
- Continuous request pattern: a 2-hour session generates hundreds of segment requests; a 100K-concurrent-viewer event generates millions simultaneously
The Manifest Is the Control Layer, Not a Static File
In adaptive streaming, the manifest file (M3U8 in HLS, MPD in DASH) describes the available segments and quality variants.
At a low scale, caching the manifest at the edge is sufficient. It changes infrequently, and serving a cached copy reduces origin load. At high scale, a static manifest becomes a constraint.
Regional congestion, capacity limits at specific PoPs, and sudden concurrency spikes all require real-time responses.
A manifest that can’t be updated dynamically forces the client player to continue requesting segments from a congested or degraded delivery path. The manifest needs to function as active orchestration, capable of steering traffic to healthier paths, triggering failover logic, and communicating capacity signals, not a passive playlist.
- Static manifest caching: appropriate up to moderate scale; becomes a bottleneck when dynamic traffic steering is needed
- Dynamic manifest generation: enables per-viewer or per-region routing decisions based on real-time capacity signals
- Failover logic: manifest-level redirects can shift traffic between CDN providers or PoPs without player-side changes
The Invisible Problem: Backbone Behavior
CDN marketing focuses heavily on PoP count and edge proximity. Geographic distance to the edge is a real factor, but once traffic reaches a significant scale, it stops being the dominant one.
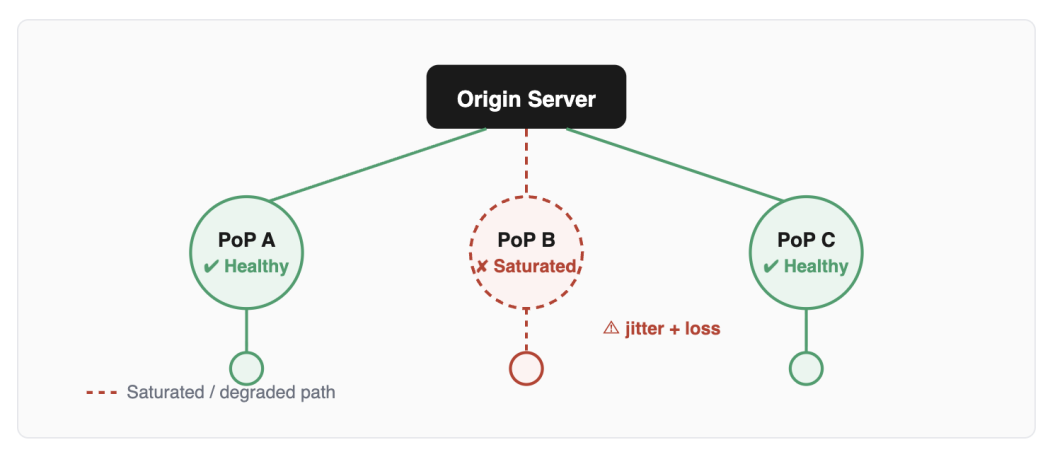
The actual path between a PoP and a viewer runs through backbone networks, peering relationships, and transit agreements. Traffic spikes from large-scale video delivery, particularly live events, can saturate peering points and introduce packet loss and jitter into paths that appear healthy in normal conditions.
Bandwidth spikes from video streaming are one of the documented causes of peering point congestion. Legacy BGP configurations lack real-time path adjustment, so traffic continues routing through saturated links while alternatives exist. The result is degraded video quality on paths that aren’t flagged as failing, which makes the issue both harder to detect and harder to attribute.
Why are Backbone Issues Harder to Diagnose Than Edge Issues
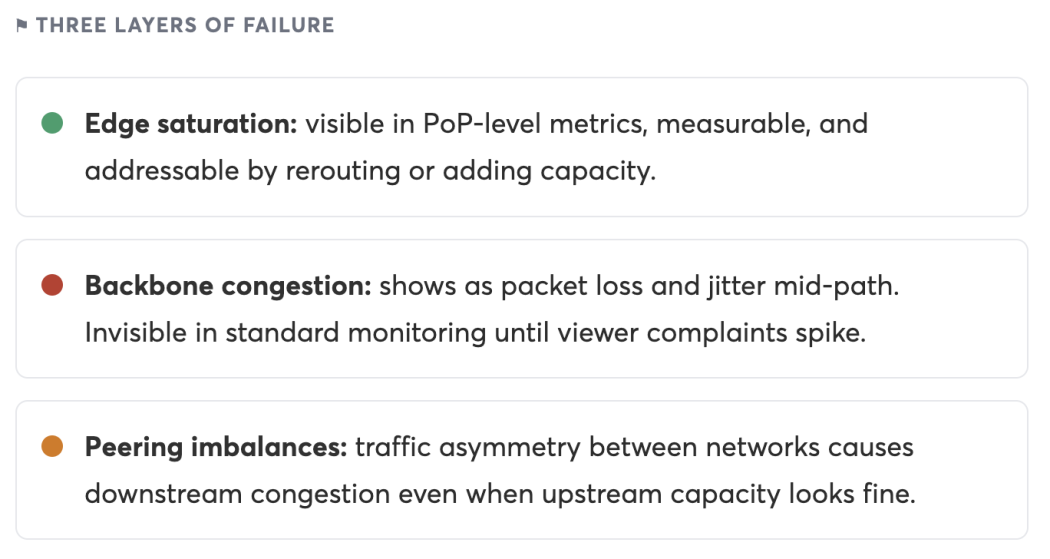
- Edge saturation: visible in PoP-level metrics, measurable, addressable by adding capacity or rerouting
- Backbone congestion: shows up as packet loss and jitter in transmission; often invisible in standard monitoring until viewer complaints spike
- Peering imbalances: traffic asymmetry between networks can cause downstream congestion even when upstream capacity looks fine
Here is the practical suggestion:
PoP count is a necessary but insufficient indicator of delivery quality at scale. The quality of backbone capacity, peering relationships, and congestion tolerance between PoPs matters more at 500TB+ per month than it does at 50TB.
The Concurrency Cliff
When One Live Event Exposes Everything
Traffic can appear stable through early growth, then a single live event reveals architectural limits that normal operation never exposed. Premieres, product launches, and breaking news are when you find out.
Scaling curves for video delivery are non-linear. Traffic can appear stable through early growth, then hit a threshold where a single live event or traffic spike reveals architectural limits that weren’t visible during normal operation.
Premieres, product launches, and breaking news events are the moments when these limits surface. The cost of discovering them under pressure is significantly higher than finding them during planned load testing.
Pricing Models That Don’t Match Video Economics
Per-Request Pricing Breaks Under Video Load
A 2-hour stream generates hundreds of segment requests. The infrastructure isn’t doing more work per request, it’s doing the same work at continuously high volume. Costs compound non-linearly.
⚡ Cost Curve by Monthly Egress
Per-request cost curve under sustained video load (illustrative, relative scale)
Many cloud and CDN platforms have moved toward per-request or per-compute-invocation billing. This works well for APIs, serverless functions, and dynamic applications where request counts reflect actual workload complexity.
Long-form video works differently, however.
A two-hour viewing session generates hundreds of segment requests. Multiply that by thousands of concurrent viewers and per-request costs compound independently of any increase in system complexity. The infrastructure isn’t doing more work per request; it’s doing the same work continuously at high volume. Cost grows because volume is sustained, not because anything changed architecturally.
- VoD streaming: predictable request volume per hour of content and concurrent viewer count
- Live streaming: highest concurrency within narrow time windows; per-request billing amplifies at exact peaks
- Bandwidth-based pricing: aligns more naturally with video economics because it scales with actual throughput rather than request events
Past 500TB/month, the difference between bandwidth-based and per-request pricing becomes a material financial consideration rather than a rounding error. Infrastructure that was cost-effective at 50TB may generate unpredictable cost curves at 500TB using the same billing model.
What the Architecture Needs to Look Like
The shift isn’t from CDN to edge computing, it’s from treating delivery as an acceleration layer to engineering it as core infrastructure.
The shift isn’t from CDN to edge computing, or from cache to compute. It’s from treating delivery as an acceleration layer to engineering it as core infrastructure. That distinction changes the design decisions at every layer.
Segment-optimized edge delivery
Cache eviction policies, memory allocation, and I/O patterns need to be tuned for sequential segment access rather than random object retrieval. This is a different optimization target than the standard CDN configuration. P2P-assisted CDN architectures, where viewers serve segments to nearby peers, offloading CDN bandwidth by up to 90% in some implementations, are increasingly viable for both live and VoD at high concurrency.
Dynamic manifest orchestration
Manifests need to be generated or modified in real time to respond to capacity signals. This enables per-region routing, CDN failover without player intervention, and traffic steering during congestion events. Static manifest caching should be treated as a fallback for low-traffic conditions, not the default for high-scale operation.
Backbone capacity engineered for sustained throughput
Peering relationships, transit agreements, and inter-PoP routing need to be designed around sustained high-throughput video flows rather than bursty web traffic. Observability at the backbone level, not just the edge, is required to detect and respond to congestion before it reaches viewers. Systems like CMCD (Common Media Client Data) enable client-side telemetry that enriches server-side observability with real player conditions.
Bandwidth-aligned pricing
Delivery infrastructure should be evaluated against bandwidth and throughput pricing rather than per-request models. Commit-based bandwidth pricing tends to produce more predictable cost curves at the petabyte scale and aligns the cost model with how video traffic actually behaves.
Metrics That Actually Matter at This Scale
Standard CDN metrics, cache hit rate, TTFB, error rate, miss the specific failure modes of high-volume video. These signals reveal problems before viewer complaints surface.
Standard CDN dashboards don’t expose most of these signals. Backbone packet loss and buffer ratio require instrumentation specific to video delivery infrastructure.
Most video delivery monitoring focuses on generic CDN metrics, cache hit rate, TTFB, and error rate. These matter, but they don’t give a complete picture of delivering health at petabyte scale.
The metrics that reveal problems specific to high-volume video are different.
- Buffer ratio: the proportion of playback time spent buffering; the most direct measure of viewer experience degradation
- Bitrate stability: frequency and magnitude of adaptive bitrate switches; excessive switching indicates transport instability
- Segment request latency distribution: p95 and p99 latency matter more than averages for understanding tail behavior under load
- Cache hit rate by segment type: live segments (short-lived) will have lower hit rates than VoD; distinguishing between them prevents misreading overall cache performance
- Backbone packet loss: measured between PoPs and at peering points, not just at the edge; invisible backbone congestion shows up here before it affects viewer metrics


